
Administration
In this section the System Logs, the Configuration Logs and the Cluster monitoring can be viewed.
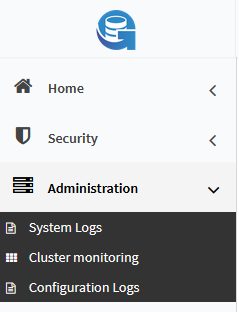
System Logs
The system logs contain information about a system stopping and starting. Here you can also add a description to the logs, to record notes.
To add a description, select a log and press the Edit button.
To save changes press the Save Changes button, then Back.
Configuration Logs
The configuration logs contain information about configuration changes, e.g., who changed what and when. By clicking on the Advanced icon on the top right, you can show some filters to easier search for specific changes.
Choose a filter and click the plus symbol. The filter now appears as a field to enter search terms. Multiple filters can be added.
To remove a filter click the minus symbol next to it.
Click Search after you filled in all filter parameters.
A search can also be saved by clicking Save. Reset resets the search parameters. Refresh refreshes the list.
Cluster Monitoring
This section shows all cluster nodes connected to the Genius Server.
You can refresh the list by clicking the Refresh button.
You can search for specific nodes by entering names or parts of names into the search filter field.
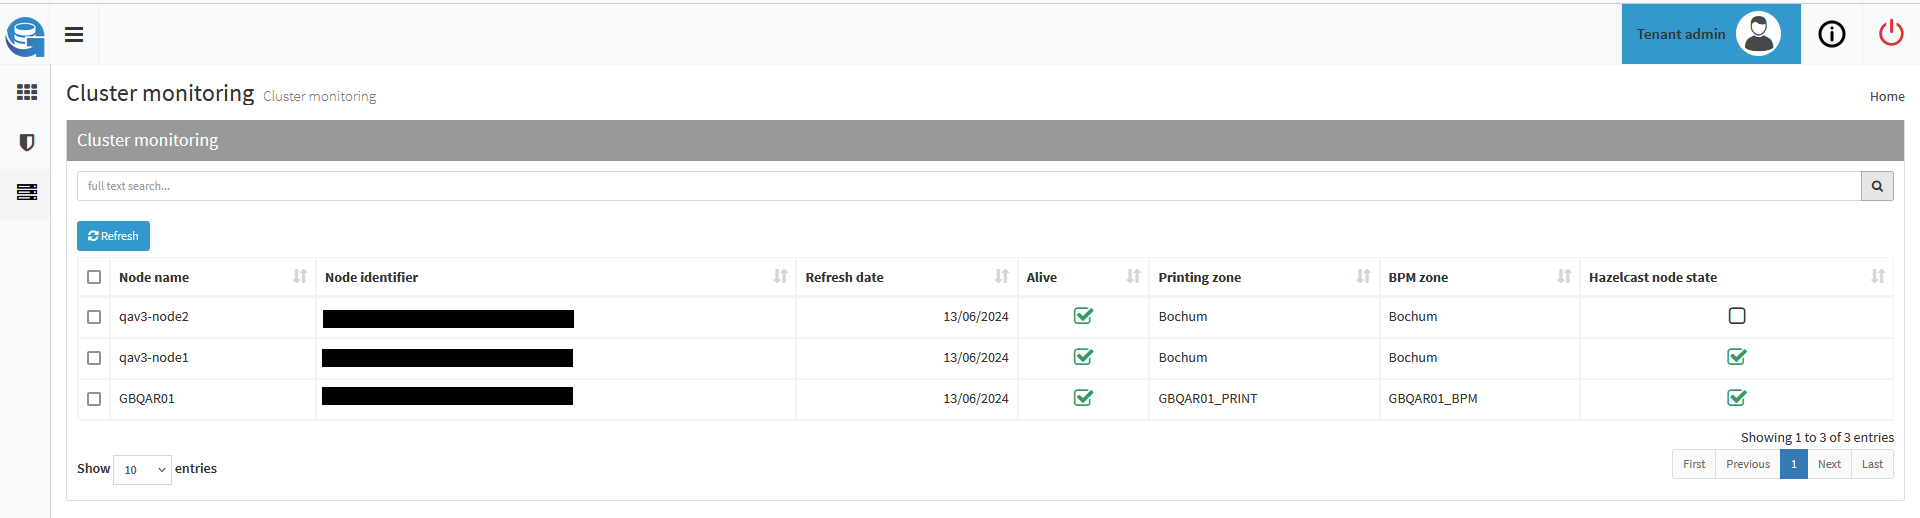
Node name: this column displays the name of the node.
Node identifier: this column displays the node identifier.
Refresh date: in this column the last refresh date is displayed, i.e., the last time the Genius Server got information on this cluster node.
Alive: in this column you can see if a cluster node is alive (green checkmar) or not (no checkmark).
Printing zone: this column shows the printing zone the cluster node belongs to.
BPM zone: this column shows the BPM zone the cluster node belongs to.
Hazelcast node state: this column shows the Hazelcast node state. If the node is a Hazelcast member, a green checkmark is shown.